Investment Property Calculator
Enter the deal and the growth rates to project cash flow, equity and IRR year by year.
Recent
Your last 10 settings, saved only in this browser. Nothing is uploaded.
This investment property calculator projects the return on a rental property you plan to buy, rent out and later sell. You enter the purchase price, financing, rent, operating costs and growth assumptions, and it shows results such as the internal rate of return (IRR), the equity multiple and the total profit after sale. It runs in your browser, is free, and needs no account or sign-up.
Use it as a real estate investment calculator to compare scenarios, such as a different down payment or a higher mortgage interest rate. It does arithmetic only. It does not include income tax, depreciation or capital gains tax, and it does not judge whether a deal is worth doing. The values in the form are an example, so replace them with your own numbers.
How to use the investment property calculator
- Enter the “Purchase price ($)” and the “Down payment (%)”. A down payment of 100 means no loan.
- Set the “Mortgage interest rate (%)” and “Loan term (years)” as your lender quotes them. Under “More options”, tick “Interest-only payments” if the loan is interest-only.
- Under “More options”, enter “Closing costs ($)” and “Repair and rehab costs ($)”.
- Enter “Monthly rent ($)” for when the property is fully rented. Under “More options”, add “Other income per month ($)” if you have any.
- Set “Vacancy allowance (%)”. Then enter “Property tax per year ($)” and “Insurance per year ($)”.
- Under “More options”, enter “HOA fees per year ($)”, “Utilities paid by the owner per year ($)” and “Other operating costs per year ($)”.
- Enter “Maintenance and repairs (%)”, “Property management (%)” and “Capital reserves (%)”. Use 0 for “Property management (%)” if you manage the property yourself.
- Set “Years you hold the property (years)”. Enter “Value growth per year (%)”, then under “More options”, the “Rent growth per year (%)”, “Expense growth per year (%)” and “Selling costs (%)”.
- Read “Internal rate of return (IRR)”, “Equity multiple”, “Total profit after sale” and the other results. Open “How it was calculated” and the “Year by year” table to check each step.
Three preset buttons load example properties, and “Reset” restores the example values. “Copy link” reopens the same inputs. “Print / save result” prints a one-page sheet; to keep a PDF, choose save as PDF in the print dialog.
What is IRR on a rental property?
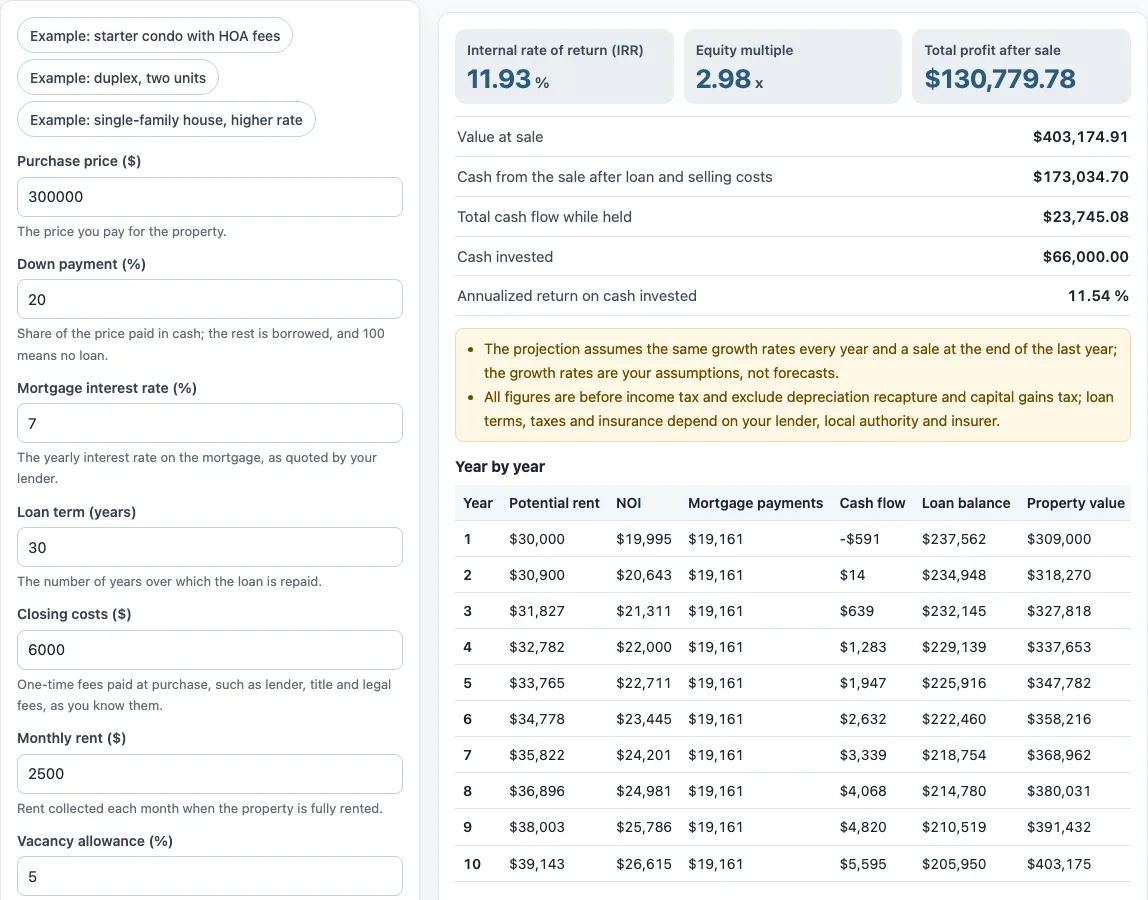
IRR, or internal rate of return, is the yearly rate that makes the investment’s yearly cash flows sum to zero. In this tool, the cash invested is the outflow at year 0, the yearly cash flows are the inflows, and the sale proceeds are added in the last year of the holding period. The default example shows an IRR of 11.93 % per year.
IRR is one percentage that reflects both the size and the timing of money going out and coming in. Cash received in an early year counts for more than the same amount received later. Two projections with the same total profit can therefore show different IRRs if their cash arrives at different times.
What does equity multiple mean?
Equity multiple is the cash you get back divided by the cash you put in. In this tool, it equals (total cash flow + sale proceeds) ÷ cash invested. The default example shows 2.98 x, based on a total cash flow of $23,745.08, sale proceeds of $173,034.70 and cash invested of $66,000.
Equity multiple does not account for time. A result of 2.98 x means the total cash returned is 2.98 times the cash invested, whether that comes back over a few years or over the full holding period. Read it together with IRR to see both the size of the return and how quickly it arrives. Cash invested here includes the down payment, closing costs and repair and rehab costs.
How do the growth rates and the sale work?
Rent grows by “Rent growth per year (%)”, and the fixed expenses (property tax, insurance, HOA fees, utilities and other costs) grow by “Expense growth per year (%)”. Maintenance, management and reserves are percentages of collected income, so they follow rent and vacancy. The property’s value grows by the value growth rate each year. In the default example rent grows 3 % a year, fixed expenses 2 % and the value 3 %, over 10 years, and selling costs are 6 %. At the end of the holding period the tool sells the property at the grown value, takes off the selling costs and the remaining loan balance, and treats what is left as the sale proceeds. The loan itself is paid on its normal schedule, so the loan payment does not change from year to year.
Sources: Corporate Finance Institute: Capitalization rate, CFPB: What is an amortization schedule?.
Frequently asked questions
Does the projection include taxes?
No. The figures are before income tax and exclude depreciation recapture and capital gains tax. “Property tax per year ($)” is a property tax bill you enter as an expense, which is different from income tax on your return.
Why does cash flow change from year to year?
Rent grows by “Rent growth per year (%)” and fixed costs grow by “Expense growth per year (%)”, and these two rates are usually different. Maintenance, management and reserves follow collected income, so they move with rent and vacancy. The loan is paid on its normal schedule, so the payment stays the same while the loan balance falls. In the default example, first-year cash flow is -$590.71 per year.
Does the calculator tell me whether a deal is good?
No. It is arithmetic only and gives no investment, loan, tax or legal advice. The results show what your entered numbers produce, not whether the property is a sound purchase.
What does “Interest-only payments” change?
When it is on, the payment covers interest only and the loan balance stays the same. This changes the yearly debt payments and the loan balance deducted at sale, which in turn changes the cash from the sale.
Are the growth rates forecasts?
No. The projection uses the constant growth rates you type and applies the same rates every year. They are your assumptions, not forecasts, and real rents, costs and prices do not move in a straight line.
Where is ROI in this tool?
The tool does not show a line labelled ROI. The closest results are “Annualized return on cash invested” and “Total profit after sale”, both based on the same “Cash invested” figure.
Related tools
- Rental property calculator: Use it to run a broader set of rental figures for a single property.
- Rental ROI calculator: Use it when your main question is the return on a rental.
- Rental property cash flow calculator: Use it to focus on the money left after expenses and debt payments.
- Cash on cash return calculator: Use it to measure the yearly cash return against the cash you put in.
- BRRRR calculator: Use it when you plan to buy, rehab, rent, refinance and repeat.
- Rental property valuation calculator: Use it to estimate a property’s value from its income.
- Buy to let mortgage calculator: Use it to work out the loan payments on a buy-to-let property.